Table 15-1
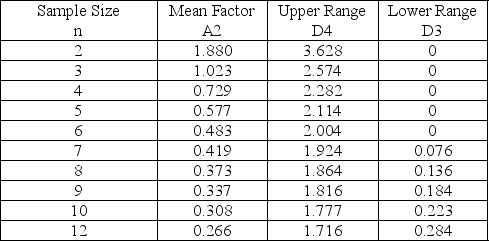
-Use the data shown below and the information in Table 15-1 to develop an upper control limit for a control chart that monitors central tendency.What is the upper control limit? 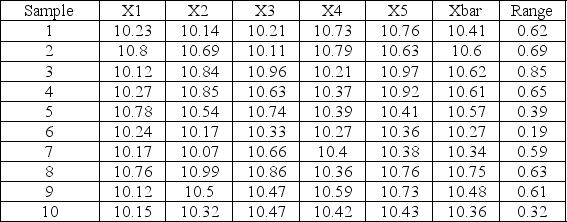
A) 0
B) 1.17
C) 10.82
D) 11.99
Correct Answer:
Verified
Q75: Technically, to achieve Six Sigma quality, there
Q76: A 400-student lecture in introductory statistics conducted
Q77: A company is producing cylindrical blocks for
Q78: Samaje studied his control chart and noticed
Q79: A company has been receiving complaints about
Q81: A retail store charts the number of
Q82: Explain the difference between control charts for
Unlock this Answer For Free Now!
View this answer and more for free by performing one of the following actions

Scan the QR code to install the App and get 2 free unlocks

Unlock quizzes for free by uploading documents