Essay
Table 15-1
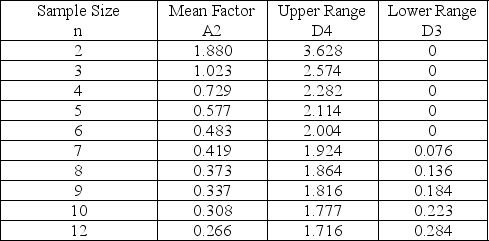
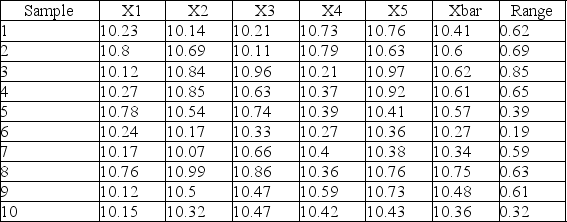
-Use the data shown below and the information in Table 15-1 to develop a control chart that monitors consistency.Use your chart to make an assessment - is the process in control?
Correct Answer:
Verified
Rbar = 0.554, so UCLR = 1.171 ...
View Answer
Unlock this answer now
Get Access to more Verified Answers free of charge
Related Questions
Q78: Samaje studied his control chart and noticed
Q79: A company has been receiving complaints about
Q80: Table 15-1 Q81: A retail store charts the number of Q82: Explain the difference between control charts for
![]()
Unlock this Answer For Free Now!
View this answer and more for free by performing one of the following actions

Scan the QR code to install the App and get 2 free unlocks

Unlock quizzes for free by uploading documents