The following graph is a ________.
A) frequency polygon 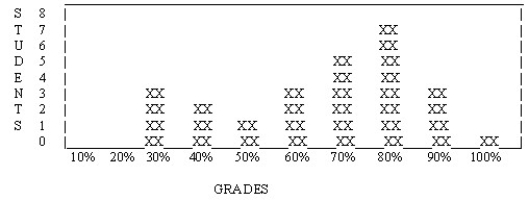
B) skewed distribution
C) frequency histogram
D) normal distribution
Correct Answer:
Verified
Q29: A count of the number of scores
Q33: In a set of incomes in which
Q41: A line graph showing a frequency distribution
Q49: A hypothetical bell-shaped distribution curve that occurs
Q51: The following distribution is _.
A) normal
Q53: In a frequency histogram, the intervals are
Q54: The scores gather at one end of
Q56: If we take a large enough number
Q57: We say that a curve is skewed
Q58: Plotting a normal distribution on a graph
Unlock this Answer For Free Now!
View this answer and more for free by performing one of the following actions

Scan the QR code to install the App and get 2 free unlocks

Unlock quizzes for free by uploading documents