The following graph is a ________.
A) frequency polygon 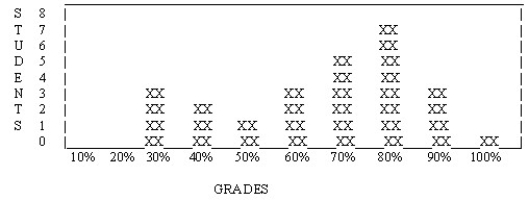
B) skewed distribution
C) frequency histogram
D) normal distribution
Correct Answer:
Verified
Q33: In a set of incomes in which
Q41: A line graph showing a frequency distribution
Q49: A hypothetical bell-shaped distribution curve that occurs
Q50: If you know that the median is
Q54: The scores gather at one end of
Q54: The scores gather at one end of
Q56: If we take a large enough number
Q57: We say that a curve is skewed
Q60: The mean and the mode fall at
Q61: The following distribution is _. 
Unlock this Answer For Free Now!
View this answer and more for free by performing one of the following actions

Scan the QR code to install the App and get 2 free unlocks

Unlock quizzes for free by uploading documents