The table below shows the level of GDP per capita in 1900 for four regions of the world, as well as their growth rates between 1900 and 1938. Plot this table to determine whether catch-up is likely to occur among these regions. Does growth theory explain the growth experience of these regions between 1900 and 1938? 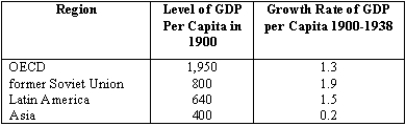
Correct Answer:
Verified
View Answer
Unlock this answer now
Get Access to more Verified Answers free of charge
Q54: Have the predictions of growth theory proven
Q55: Economic development is
A)the branch of economics that
Q56: Does the growth experience of poorer countries
Q57: Which of the following is an emerging
Q58: The share of the population in the
Q60: According to economic growth theory, how does
Q61: Which of the following statements is true?
A)China
Q62: Today, there are more than 3 billion
Q63: The term developing country describes those countries
Q64: More than 50 percent of the world's
Unlock this Answer For Free Now!
View this answer and more for free by performing one of the following actions

Scan the QR code to install the App and get 2 free unlocks

Unlock quizzes for free by uploading documents