The table below shows the percentage difference between real and potential GDP and the rate of inflation for the years 1999 through 2003. If there were a presidential election in the year 2000, would these data support the view that there was a political business cycle during this period? 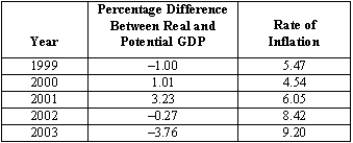
Correct Answer:
Verified
View Answer
Unlock this answer now
Get Access to more Verified Answers free of charge
Q161: The table shows the percentage difference between
Q162: Between 1942 and 1951, the Federal Reserve,
Q163: Countries with fixed exchange rates will have
Q164: Is the interest rate on the federal
Q165: The Bretton Woods system from the end
Q167: Exchange market interventions involve
A)fixing the exchange rate
Q168: If the British government intends to raise
Q169: Answer the questions below: Q170: Describe in detail how the Fed takes Q171: Suppose Congress had the power to set
![]()
Unlock this Answer For Free Now!
View this answer and more for free by performing one of the following actions

Scan the QR code to install the App and get 2 free unlocks

Unlock quizzes for free by uploading documents