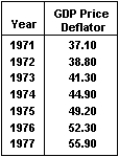
The figure below plots real and potential GDP between 1971 and 1977. Given the data in the corresponding table, can changes in the rate of inflation over this period be explained by the percent deviation between real and potential GDP? Do these data support or refute the validity of the assumptions about the IA line? 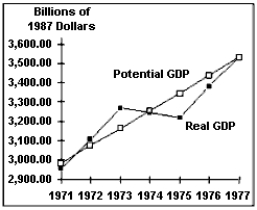
Correct Answer:
Verified
View Answer
Unlock this answer now
Get Access to more Verified Answers free of charge
Q175: If the economy is in a recession,
Q176: If real and potential GDP are equal,
Q177: The table below shows the price level
Q178: Explain why the inflation adjustment line is
Q179: According to historical evidence, when real GDP
Q181: Suppose the Fed is considering three different
Q182: During an economic recovery, the rate of
Q183: Which of the following statements are true,
Q184: Suppose inflation has been increasing in Europe,
Q185: During a recession, the rate of inflation
Unlock this Answer For Free Now!
View this answer and more for free by performing one of the following actions

Scan the QR code to install the App and get 2 free unlocks

Unlock quizzes for free by uploading documents