Exhibit 23-4 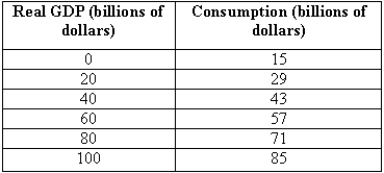
-Plot the consumption function based on the data in Exhibit 23-4. What is the marginal propensity to consume? If the marginal propensity to consume changes to 0.85, show what happens to the consumption function.
Correct Answer:
Verified
View Answer
Unlock this answer now
Get Access to more Verified Answers free of charge
Q86: When examining consumption behavior at the household
Q87: Answer the questions below: Q88: The size of the MPC determines how Q89: The slope of the 45-degree line Q90: Interest rates do not affect consumption. Q92: If firms decide to decrease their purchases Q93: Define the marginal propensity to consume. Graphically, Q94: The consumption relationship in this chapter assumes Q95: Which of the following statements is true? Q96: If foreigners decide to increase their purchases
![]()
A)equals zero.
B)equals
A)A
Unlock this Answer For Free Now!
View this answer and more for free by performing one of the following actions

Scan the QR code to install the App and get 2 free unlocks

Unlock quizzes for free by uploading documents