Exhibit 2-1 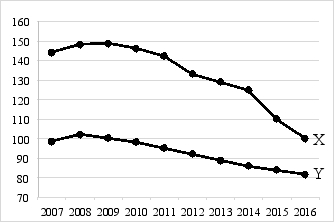
-Exhibit 2-1 shows movements of two variables, X and Y, from 2007 through 2016. From this diagram the most one can conclude is that
A) X and Y are positively correlated with each other.
B) X and Y are negatively correlated with each other.
C) X and Y are positively correlated with each other and either X causes Y or Y causes X.
D) we cannot say anything about how X and Y are related because we do not know the units of measurement for X and Y.
E) X and Y are not correlated with each other.
Correct Answer:
Verified
Q21: Explain why it is more difficult to
Q22: Economics has always been a good example
Q23: A microeconomic model must be much smaller
Q24: An economic model is a tool used
Q25: A model gives the most realistic description
Unlock this Answer For Free Now!
View this answer and more for free by performing one of the following actions

Scan the QR code to install the App and get 2 free unlocks

Unlock quizzes for free by uploading documents