Curve B below represents the oxygen-hemoglobin dissociation curve for normal body temperature, arterial hydrogen ion concentration, and DPG concentration. 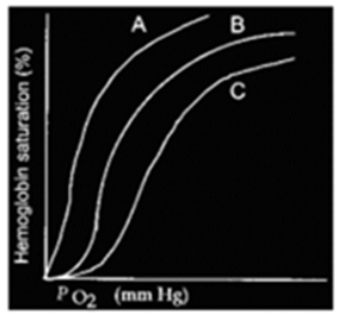
A) Curve A may represent the dissociation at higher than normal arterial H+ concentration.
B) Curve C may represent the dissociation at lower than normal body temperature.
C) Curve A may represent the dissociation at very low 2,3 diphosphoglycerate levels.
D) Curve C may represent the dissociation at lower than normal arterial H+ concentration.
E) Curve A may represent the dissociation at higher than normal body temperature.
Correct Answer:
Verified
Q9: Which is normally TRUE about the intrapleural
Q17: Which of the following statements about the
Q18: Which of the following is NOT a
Q19: During an unforced exhalation/expiration, which would NOT
Q20: Which of the following is a
Q22: Which of the following would cause a
Q23: If all other factors remain the same,
Q24: Regarding the partial pressures of O2 and
Q25: Which is a result of hyperventilation?
A) respiratory
Q26: Which of these correctly describes the chloride
Unlock this Answer For Free Now!
View this answer and more for free by performing one of the following actions

Scan the QR code to install the App and get 2 free unlocks

Unlock quizzes for free by uploading documents