Exhibit 19-1 -Refer to Exhibit 19-1.The Regression Line for the Combination of for the Combination
Exhibit 19-1
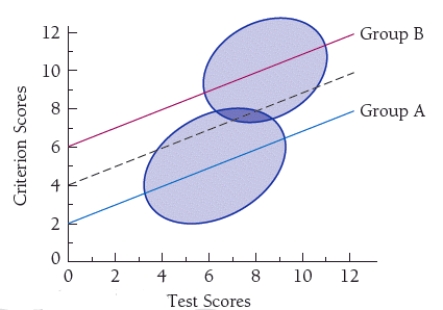
-Refer to Exhibit 19-1.The regression line for the combination of groups A and B in the above figure yields a predicted score of approximately ____ for a test score of 6.
A) 4.0
B) 5.5
C) 7.0
D) 8.5
Correct Answer:
Verified
Q4: Which of the following is true of
Q8: Flaugher (1978)contends that arguments about test bias
Q15: The highest scores on the SAT Reasoning
Q16: Much of the controversy regarding testing has
Q16: Exhibit 19-1 Q17: In one study on content bias in Q18: The finding that intelligence scores have changed Q18: Exhibit 19-1 Q19: A clear case of test bias is Q20: Which of the following is true of
![]()
![]()
Unlock this Answer For Free Now!
View this answer and more for free by performing one of the following actions

Scan the QR code to install the App and get 2 free unlocks

Unlock quizzes for free by uploading documents