Figure TB 10-4
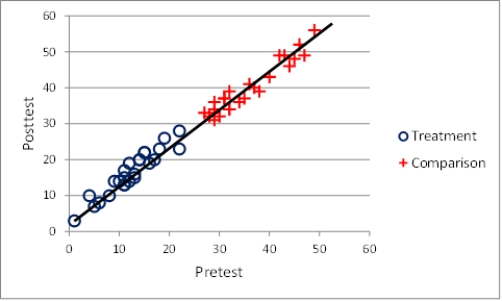
-The graph in the accompanying figure was most likely generated by a study using the ____ design.
A) non-equivalent groups
B) regression discontinuity
C) proxy-pretest
D) separate pre-post samples
Correct Answer:
Verified
Q35: Figure TB 10-2
Q36: Figure TB 10-4 Q37: Narrative 10-1 -Daycare Center - Part I Q38: Narrative 10-2 -Daycare Center - Part II Q39: A design that includes two waves of Q41: In the archived proxy-pretest design,the pretest is Q42: A regression point displacement design is particularly Q43: Figure TB 10-14 Q44: A proxy-pretest design is most likely to Q45: The _ design allows the researcher to
![]()
Ken
Ken
![]()
Unlock this Answer For Free Now!
View this answer and more for free by performing one of the following actions

Scan the QR code to install the App and get 2 free unlocks

Unlock quizzes for free by uploading documents