Use the sales data given below to determine: 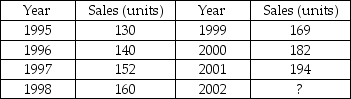 (a)The least squares trend line.
(b)The predicted value for 2002 sales.
(c)The MAD.
(d)The unadjusted forecasting MSE.
Correct Answer:
Verified
View Answer
Unlock this answer now
Get Access to more Verified Answers free of charge
Q76: Use simple exponential smoothing with α =
Q78: In picking the smoothing constant for an
Q79: A seasonal index of _ indicates that
Q80: If the Q1 demand for a particular
Q84: Given the following data and seasonal index:
Q86: The following table represents the number of
Q99: Daily high temperatures in the city of
Q107: Briefly describe the structure of a scatter
Q121: Briefly describe the jury of executive opinion
Q126: Describe the naïve forecasting method.
Unlock this Answer For Free Now!
View this answer and more for free by performing one of the following actions

Scan the QR code to install the App and get 2 free unlocks

Unlock quizzes for free by uploading documents