Multiple Choice
Table 15-1 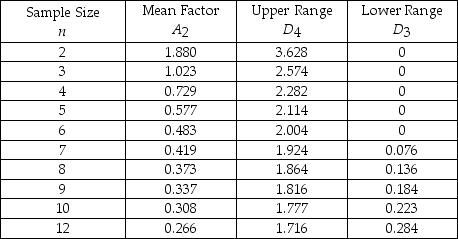
-Refer to Table 15-1.To guarantee that cans of soda are properly filled,some cans are sampled and the amounts measured.The overall average for the samples is 12 ounces.Each sample contains 10 cans.The average range is 0.4 ounces.The lower control chart limit for the sample averages would be
A) 12.1232.
B) 11.8768.
C) 13.2.
D) 12.308.
E) None of the above
Correct Answer:
Verified
Related Questions
Q32: A p-chart is based on which of
Q33: Bags of pretzels are sampled to ensure
Q34: Control charts that are used to monitor
Q35: Table 15-1 Q36: Who introduced control charts in 1924?![]()
A)W.Edwards Deming
B)Philip

