Table 15-2
Given the sample results (100 units in each sample) : 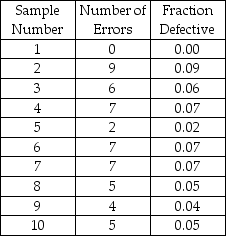
-Based on Table 15-2,find the 95.5% lower limit of the appropriate p-chart.
A) 0.0076
B) 0.0964
C) 0.2014
D) 0.1397
E) None of the above
Correct Answer:
Verified
Q55: Table 15-2
Given the sample results (100 units
Q56: A quality control program is being developed
Q57: Table 15-2
Given the sample results (100 units
Q58: When receiving a shipment from a supplier,inspection
Q59: An airline company tracks the number of
Q64: The U.S.government award for quality achievement is
Q81: A retail store charts the number of
Q85: A local children's boutique specializes in formal
Q94: A p-chart has been developed for a
Q95: A p-chart has been developed for a
Unlock this Answer For Free Now!
View this answer and more for free by performing one of the following actions

Scan the QR code to install the App and get 2 free unlocks

Unlock quizzes for free by uploading documents