Table 15-2
Given the sample results (100 units in each sample) : 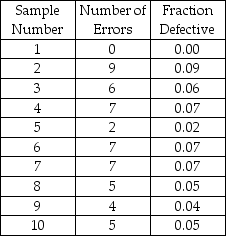
-The c-chart is useful when we
A) take a number of measurements and compute the average.
B) take a number of measurements and compute the ranges.
C) find the fraction of the production lot defective.
D) find the number of defective items in a production lot.
E) None of the above
Correct Answer:
Verified
Q45: Defects in computer hard-drives will usually render
Q46: A coffee dispenser is supposed to dispense
Q47: Technically,to achieve Six Sigma quality,there would have
Q48: Which of the following control charts is/are
Q49: A plant manager is concerned with the
Q51: Defects in marble countertops usually require the
Q52: Table 15-2
Given the sample results (100 units
Q53: Table 15-2
Given the sample results (100 units
Q54: Which of the following control charts is/are
Q55: Table 15-2
Given the sample results (100 units
Unlock this Answer For Free Now!
View this answer and more for free by performing one of the following actions

Scan the QR code to install the App and get 2 free unlocks

Unlock quizzes for free by uploading documents