Use the data shown below to answer the following question(s) .
Captain Jack Automobiles launched a new car and tabulated the below data for the new launch. 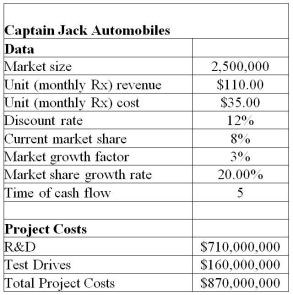 The project manager identified the following distributions and parameters for these variables:
Market size: normal with a mean of 2,000,000 units and a standard deviation of 400,000 units
R&D costs: uniform between $639,000,000 and $781,000,000
Test Drives: lognormal with mean of $160,000,000 and standard deviation $16,000,000
Annual market growth factor: triangular with minimum = 2%,maximum = 6%,and most likely = 3%
Annual market share growth rate: triangular with minimum = 15%,maximum = 25%,and most likely = 20%
Use 5,000 trials to generate the simulation model using Crystal Ball.
-In the NPV forecast chart generated after running the simulation,you enter the number 0 in the right range box of the forecast chart and press the enter key.What exactly is the result of the above action?
A) The percentage of risk that the NPV over the five years will not be positive is determined.
B) The cumulative profit over the five year range is determined.
C) It determines the number of trials to be specified in the Run Preferences item of the Run group.
D) It determines the number of trials shown in the NPV forecast chart.
Correct Answer:
Verified
Q4: For the below given data,Reuben wanted to
Q5: In a forecast chart provided by Crystal
Q6: In a forecast chart provided by Crystal
Q7: Use the data shown below to answer
Q8: Use the data shown below to answer
Q10: _ is the probability of occurrence of
Q11: The Sampling tab of Crystal Ball is
Q12: Use the data shown below to answer
Q13: Which of the following contains the Trials
Q14: Latin Hypercube sampling differs from Monte Carlo
Unlock this Answer For Free Now!
View this answer and more for free by performing one of the following actions

Scan the QR code to install the App and get 2 free unlocks

Unlock quizzes for free by uploading documents