Use the data shown below to answer the following question(s) .
Captain Jack Automobiles launched a new car and tabulated the below data for the new launch. 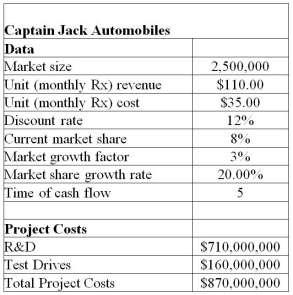 The project manager identified the following distributions and parameters for these variables:
Market size: normal with a mean of 2,000,000 units and a standard deviation of 400,000 units
R&D costs: uniform between $639,000,000 and $781,000,000
Test Drives: lognormal with mean of $160,000,000 and standard deviation $16,000,000
Annual market growth factor: triangular with minimum = 2%,maximum = 6%,and most likely = 3%
Annual market share growth rate: triangular with minimum = 15%,maximum = 25%,and most likely = 20%
Use 5,000 trails to generate the simulation model for NPV using Crystal Ball.
-Using the Tornado Chart tool,determine the assumption that has the least impact on the cumulative net profit for year 1.
A) Market size
B) R&D
C) Test Drives
D) Time of cash flow
Correct Answer:
Verified
Q42: In the data table generated along with
Q43: Use the data set shown below to
Q44: The spider chart shows the results as
Q45: Use the data set shown below to
Q46: Use the data set shown below to
Q48: When compared to the forecast without correlated
Q49: Prior to running the simulation,using the Tornado
Q50: Use the data set shown below to
Q51: With the inherent uncertainty in sales forecasts,_
Q52: Use the data set shown below to
Unlock this Answer For Free Now!
View this answer and more for free by performing one of the following actions

Scan the QR code to install the App and get 2 free unlocks

Unlock quizzes for free by uploading documents