Find the control limits for a p-chart using the below information: 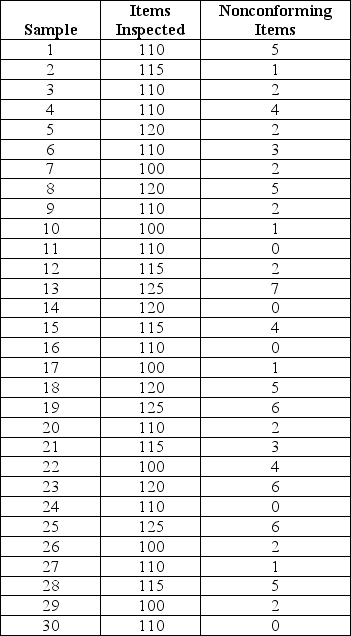
A) LCL = 0.019 and UCL = 0.069
B) LCL = 0 and UCL = 0.016
C) LCL = 0.004 and UCL = 0.20
D) LCL = 0 and UCL = 0.069
Correct Answer:
Verified
Q74: For Typhoon Shampoo,the lower specification fill weight
Q75: In manufacturing,the tolerance is the target value
Q76: The distinction between quality control attributes and
Q77: The canister of No Way Bug Spray
Q78: All of the following are important elements
Q80: The sample statistics will fall randomly within
Q81: What is the role of statistics and
Q82: When a process is in statistical control,the
Q83: Differentiate between a run chart and a
Q84: Briefly discuss the advantages and disadvantages of
Unlock this Answer For Free Now!
View this answer and more for free by performing one of the following actions

Scan the QR code to install the App and get 2 free unlocks

Unlock quizzes for free by uploading documents