Use the data given below to answer the following question(s) .
The table below shows the car sales from the year 2002-2007.The forecaster assumes a smoothing constant of 0.8 and uses the exponential smoothing model to determine the forecast for the future. 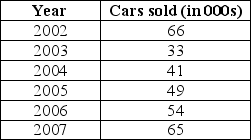
-From the data given above,what is the forecast-in 000s-for the year 2006?
A) 39.60 units
B) 40.72 units
C) 47.34 units
D) 52.67 units
Correct Answer:
Verified
Q33: Use the data given below to answer
Q34: Use the data given below to answer
Q35: Use the data given below to answer
Q36: Use the data given below to answer
Q37: Use the data given below to answer
Q39: Use the data given below to answer
Q40: Use the data given below to answer
Q41: Use the data given below to answer
Q42: Use the data given below to answer
Q43: Use the data given below to answer
Unlock this Answer For Free Now!
View this answer and more for free by performing one of the following actions

Scan the QR code to install the App and get 2 free unlocks

Unlock quizzes for free by uploading documents