TABLE 18-9
The manufacturer of canned food constructed control charts and analyzed several quality characteristics.One characteristic of interest is the weight of the filled cans.The lower specification limit for weight is 2.95 pounds.The table below provides the range and mean of the weights of five cans tested every fifteen minutes during a day's production. 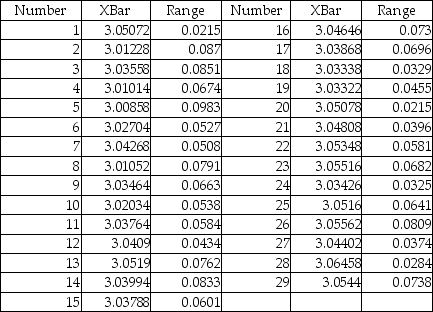
-Referring to Table 18-9,an  chart is to be used for the weight.One way to obtain the control limits is to take the grand mean and add and subtract the product of A2 times the mean of the sample ranges.For this data set,the value of A2 is ________.
Correct Answer:
Verified
Q45: TABLE 18-9
The manufacturer of cat
Q55: TABLE 18-9
The manufacturer of
Q112: TABLE 18-9
The manufacturer of canned food constructed
Q113: TABLE 18-9
The manufacturer of canned food constructed
Q116: True or False: CPL > 1 implies
Q118: TABLE 18-10
Below is the number of defective
Q119: TABLE 18-9
The manufacturer of canned food constructed
Q120: TABLE 18-9
The manufacturer of canned food constructed
Q122: TABLE 18-10
Below is the number of defective
Q155: The Shewhart-Deming cycle plays an important role
Unlock this Answer For Free Now!
View this answer and more for free by performing one of the following actions

Scan the QR code to install the App and get 2 free unlocks

Unlock quizzes for free by uploading documents