TABLE 17-1
A real estate builder wishes to determine how house size (House) is influenced by family income (Income) ,family size (Size) ,and education of the head of household (School) .House size is measured in hundreds of square feet,income is measured in thousands of dollars,and education is in years.The builder randomly selected 50 families and ran the multiple regression.Microsoft Excel output is provided below: 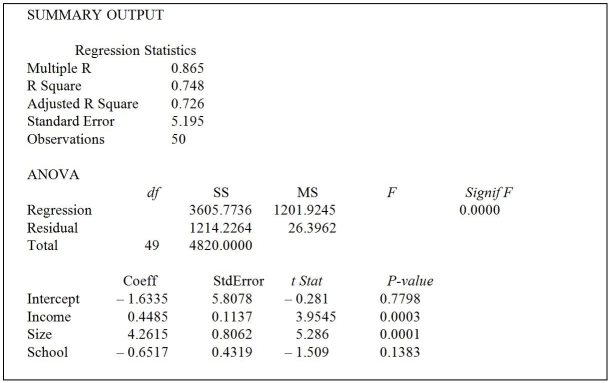
-Referring to Table 17-1,when the builder used a simple linear regression model with house size (House) as the dependent variable and education (School) as the independent variable,he obtained an r2 value of 23.0%.What additional percentage of the total variation in house size has been explained by including family size and income in the multiple regression?
A) 2.8%
B) 51.8%
C) 72.6%
D) 74.8%
Correct Answer:
Verified
Q44: An economist is interested to see how
Q52: A manager of a product sales group
Q54: A supplier of silicone sheets for producers
Q60: Four surgical procedures currently are used to
Q61: TABLE 17-1
A real estate builder wishes to
Q62: TABLE 17-1
A real estate builder wishes to
Q63: A certain type of rare gem serves
Q66: A political pollster randomly selects a sample
Q69: A Paso Robles wine producer wanted to
Q79: An investor wanted to forecast the price
Unlock this Answer For Free Now!
View this answer and more for free by performing one of the following actions

Scan the QR code to install the App and get 2 free unlocks

Unlock quizzes for free by uploading documents