TABLE 17-3
A financial analyst wanted to examine the relationship between salary (in $1,000)and 4 variables: age (X1 = Age),experience in the field (X2 = Exper),number of degrees (X3 = Degrees),and number of previous jobs in the field (X4 = Prevjobs).He took a sample of 20 employees and obtained the following Microsoft Excel output:
SUMMARY OUTPUT
Regression Statistics 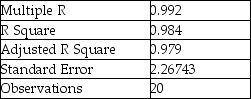 ANOVA
ANOVA 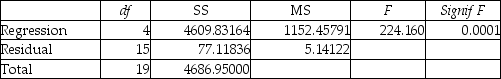
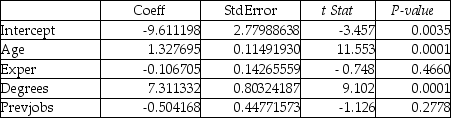
-Referring to Table 17-3,the analyst decided to construct a 99% confidence interval for β3.The confidence interval is from ________ to ________.
Correct Answer:
Verified
Q86: TABLE 17-3
A financial analyst wanted to examine
Q87: TABLE 17-3
A financial analyst wanted to examine
Q88: TABLE 17-3
A financial analyst wanted to examine
Q89: TABLE 17-3
A financial analyst wanted to examine
Q90: TABLE 17-3
A financial analyst wanted to examine
Q92: TABLE 17-3
A financial analyst wanted to examine
Q93: TABLE 17-5
You worked as an intern at
Q94: TABLE 17-5
You worked as an intern at
Q95: TABLE 17-3
A financial analyst wanted to examine
Q96: TABLE 17-3
A financial analyst wanted to examine
Unlock this Answer For Free Now!
View this answer and more for free by performing one of the following actions

Scan the QR code to install the App and get 2 free unlocks

Unlock quizzes for free by uploading documents