TABLE 14-4
A real estate builder wishes to determine how house size (House) is influenced by family income (Income) and family size (Size) .House size is measured in hundreds of square feet and income is measured in thousands of dollars.The builder randomly selected 50 families and ran the multiple regression.Partial Microsoft Excel output is provided below: 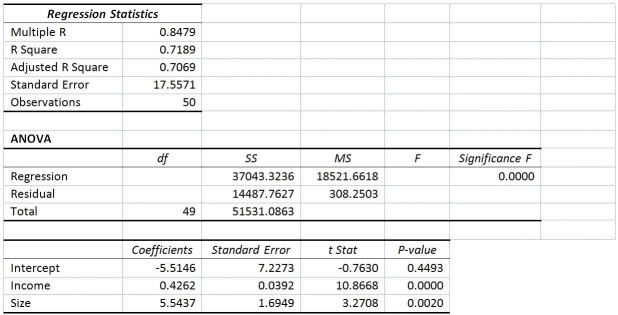 Also SSR (X1 ∣ X2) = 36400.6326 and SSR (X2 ∣ X1) = 3297.7917
-Referring to Table 14-4,when the builder used a simple linear regression model with house size (House) as the dependent variable and family size (Size) as the independent variable,he obtained an r2 value of 1.25%.What additional percentage of the total variation in house size has been explained by including income in the multiple regression?
A) 15.00%
B) 70.64%
C) 71.50%
D) 73.62%
Correct Answer:
Verified
Q25: TABLE 14-4
A real estate builder wishes to
Q26: TABLE 14-4
A real estate builder wishes to
Q27: TABLE 14-3
An economist is interested to see
Q27: TABLE 14-4
A real estate builder wishes to
Q31: TABLE 14-3
An economist is interested to see
Q34: TABLE 14-3
An economist is interested to see
Q35: TABLE 14-3
An economist is interested to see
Q35: TABLE 14-4
A real estate builder wishes to
Q38: TABLE 14-3
An economist is interested to see
Q40: TABLE 14-3
An economist is interested to see
Unlock this Answer For Free Now!
View this answer and more for free by performing one of the following actions

Scan the QR code to install the App and get 2 free unlocks

Unlock quizzes for free by uploading documents