TABLE 14-8
A financial analyst wanted to examine the relationship between salary (in $1,000)and 2 variables: age
(X1 = Age)and experience in the field (X2 = Exper).He took a sample of 20 employees and obtained the following Microsoft Excel output: 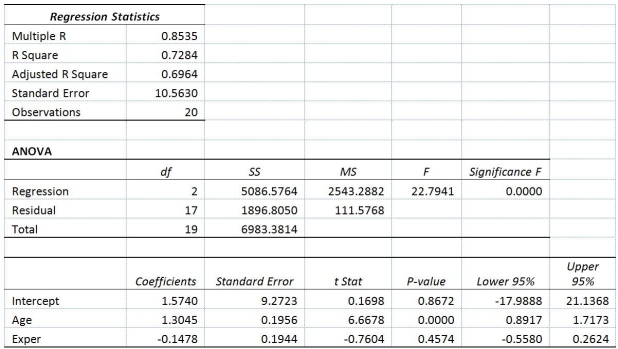 Also,the sum of squares due to the regression for the model that includes only Age is 5022.0654 while the sum of squares due to the regression for the model that includes only Exper is 125.9848.
-Referring to Table 14-8,________% of the variation in salary can be explained by the variation in experience while holding age constant.
Correct Answer:
Verified
Q126: TABLE 14-10
You worked as an intern at
Q148: TABLE 14-9
You decide to predict gasoline prices
Q149: TABLE 14-9
You decide to predict gasoline prices
Q150: TABLE 14-8
A financial analyst wanted to examine
Q151: TABLE 14-8
A financial analyst wanted to examine
Q152: TABLE 14-10
You worked as an intern at
Q155: TABLE 14-8
A financial analyst wanted to examine
Q156: TABLE 14-8
A financial analyst wanted to examine
Q157: TABLE 14-8
A financial analyst wanted to examine
Q158: TABLE 14-8
A financial analyst wanted to examine
Unlock this Answer For Free Now!
View this answer and more for free by performing one of the following actions

Scan the QR code to install the App and get 2 free unlocks

Unlock quizzes for free by uploading documents