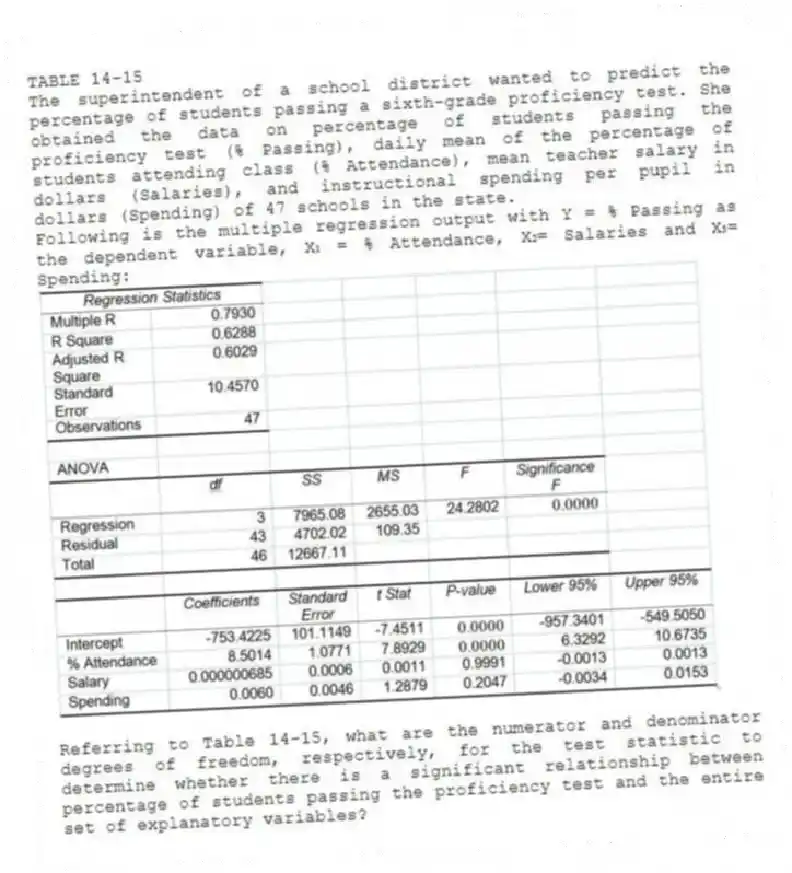
TABLE 14-15
The superintendent of a school district wanted to predict the percentage of students passing a sixth-grade proficiency test. She obtained the data on percentage of students passing the proficiency test (% Passing), daily mean of the percentage of students attending class (% Attendance), mean teacher salary in dollars (Salaries), and instructional spending per pupil in dollars (Spending) of 47 schools in the state.
Following is the multiple regression output with Y = % Passing as the dependent variable, X₁ = % Attendance, X₂= Salaries and X₃= Spending:

-Referring to Table 14-15, what are the numerator and denominator degrees of freedom, respectively, for the test statistic to determine whether there is a significant relationship between percentage of students passing the proficiency test and the entire set of explanatory variables?
Correct Answer:
Verified
Q191: TABLE 14-15
The superintendent of a school district
Q192: TABLE 14-15
The superintendent of a school district
Q193: TABLE 14-15
The superintendent of a school district
Q194: TABLE 14-15
The superintendent of a school district
Q195: TABLE 14-15
The superintendent of a school district
Q197: TABLE 14-15
The superintendent of a school district
Q198: TABLE 14-15
The superintendent of a school district
Q199: TABLE 14-15
The superintendent of a school district
Q200: TABLE 14-15
The superintendent of a school district
Q201: TABLE 14-15
The superintendent of a school district
Unlock this Answer For Free Now!
View this answer and more for free by performing one of the following actions

Scan the QR code to install the App and get 2 free unlocks

Unlock quizzes for free by uploading documents