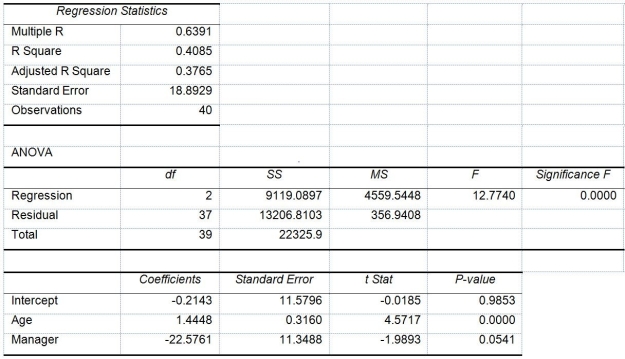
TABLE 14-17
Given below are results from the regression analysis where the dependent variable is the number of weeks a worker is unemployed due to a layoff (Unemploy)and the independent variables are the age of the worker (Age)and a dummy variable for management position (Manager: 1 = yes,0 = no).
The results of the regression analysis are given below: 
-Referring to Table 14-17,what are the lower and upper limits of the 95% confidence interval estimate for the difference in the mean number of weeks a worker is unemployed due to a layoff between a worker who is in a management position and one who is not after taking into consideration the effect of all the other independent variables?
Correct Answer:
Verified
Q282: TABLE 14-17
Given below are results from the
Q283: TABLE 14-17
Given below are results from the
Q284: TABLE 14-17
Given below are results from the
Q285: TABLE 14-17
Given below are results from the
Q286: TABLE 14-17
Given below are results from the
Q288: TABLE 14-17
Given below are results from the
Q289: TABLE 14-17
Given below are results from the
Q290: TABLE 14-17
Given below are results from the
Q291: TABLE 14-17
Given below are results from the
Q292: TABLE 14-17
Given below are results from the
Unlock this Answer For Free Now!
View this answer and more for free by performing one of the following actions

Scan the QR code to install the App and get 2 free unlocks

Unlock quizzes for free by uploading documents