TABLE 10-13
The amount of time required to reach a customer service representative has a huge impact on customer satisfaction.Below is the Excel output from a study to see whether there is evidence of a difference in the mean amounts of time required to reach a customer service representative between two hotels.Assume that the population variances in the amount of time for the two hotels are not equal. 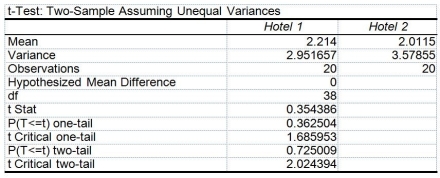
-Referring to Table 10-13,what is(are) the critical value(s) of the relevant hypothesis test if the level of significance is 0.10?
A) 1.6860
B) ±1.6860
C) 2.0244
D) ±2.0244
Correct Answer:
Verified
Q142: The F test used for testing the
Q144: TABLE 10-11
The dean of a college is
Q158: TABLE 10-12
A quality control engineer is in
Q159: TABLE 10-11
The dean of a college is
Q161: TABLE 10-13
The amount of time required to
Q162: TABLE 10-13
The amount of time required to
Q164: TABLE 10-13
The amount of time required to
Q165: TABLE 10-13
The amount of time required to
Q168: TABLE 10-13
The amount of time required to
Q180: F tests are one-tail tests.
Unlock this Answer For Free Now!
View this answer and more for free by performing one of the following actions

Scan the QR code to install the App and get 2 free unlocks

Unlock quizzes for free by uploading documents