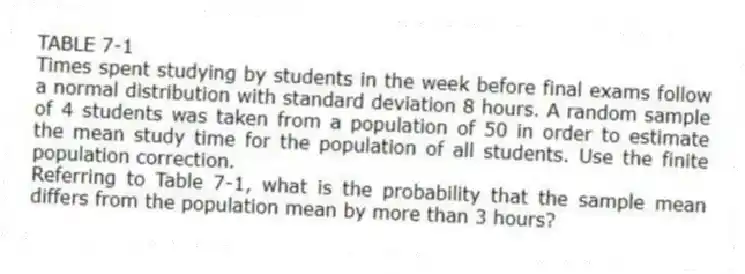
TABLE 7-1
Times spent studying by students in the week before final exams follow a normal distribution with standard deviation 8 hours. A random sample of 4 students was taken from a population of 50 in order to estimate the mean study time for the population of all students. Use the finite population correction.
-Referring to Table 7-1, what is the probability that the sample mean differs from the population mean by more than 3 hours?
Correct Answer:
Verified
Q42: The use of the finite population correction
Q43: You use the finite population correction factor
Q45: TABLE 7-1
Times spent studying by students in
Q46: TABLE 7-1
Times spent studying by students in
Q48: TABLE 7-2
According to a survey, only 15%
Q49: TABLE 7-2
According to a survey, only 15%
Q51: TABLE 6-1
A company has 125 personal computers.
Q53: TABLE 7-1
Times spent studying by students in
Q54: TABLE 7-2
According to a survey, only 15%
Q55: TABLE 7-1
Times spent studying by students in
Unlock this Answer For Free Now!
View this answer and more for free by performing one of the following actions

Scan the QR code to install the App and get 2 free unlocks

Unlock quizzes for free by uploading documents