TABLE 2-18
The stem-and-leaf display below shows the result of a survey of 50 students on their satisfaction with their school,with the higher scores representing a higher level of satisfaction. 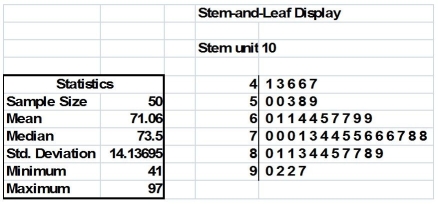
-True or False: Some business analytics involve starting with many variables and are then followed by filtering the data by exploring specific combinations of categorical values or numerical range.In Excel,this approach is mimicked by using a drill-down.
Correct Answer:
Verified
Q13: True or False: Double-clicking a cell in
Q26: True or False: There is no significant
Q176: TABLE 2-18
The stem-and-leaf display below shows the
Q180: TABLE 2-18
The stem-and-leaf display below shows the
Q183: True or False: The Guidelines for Developing
Q183: TABLE 2-18
The stem-and-leaf display below shows the
Q184: TABLE 2-18
The stem-and-leaf display below shows the
Q185: True or False: The Guidelines for Developing
Q186: True or False: The Guidelines for Developing
Q187: True or False: When you work with
Unlock this Answer For Free Now!
View this answer and more for free by performing one of the following actions

Scan the QR code to install the App and get 2 free unlocks

Unlock quizzes for free by uploading documents