The diagram shows the graphic data from a CO2 response test.On the basis of the gross change,what physiologic response do these data represent? 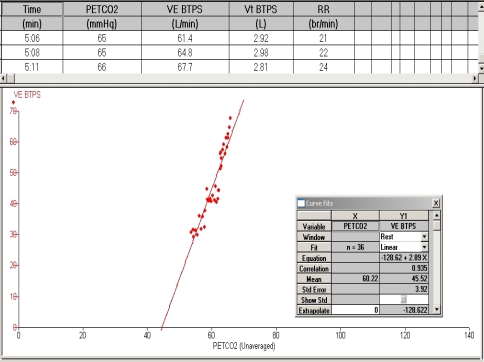
A) Blunted CO2 response
B) 3.5 L/min/mm Hg
C) Normal response
D) 0.5 L/min/mm Hg
Correct Answer:
Verified
Q14: A circuit is set up to perform
Q15: What is the calculated VD/VT ratio,given the
Q16: A subject has the following data recorded
Q17: A patient with COPD has the following
Q18: The VD/VT ratio may be estimated noninvasively
Q19: Which of the following statements best describes
Q20: P100 is the:
A) Ventilation in liters per
Q21: The high altitude simulation test is used
Q23: All of the following would cause an
Q24: What formula can you use to estimate
Unlock this Answer For Free Now!
View this answer and more for free by performing one of the following actions

Scan the QR code to install the App and get 2 free unlocks

Unlock quizzes for free by uploading documents