Assembly Line
Random samples of 200 parts were taken on an assembly line every hour for the past 25 hours.The number of defective parts is shown in the accompanying table. 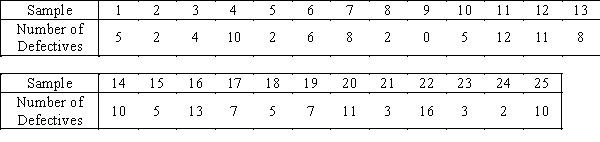
-{Assembly Line Narrative} Calculate the centerline and control limits for the p chart.
Correct Answer:
Verified
View Answer
Unlock this answer now
Get Access to more Verified Answers free of charge
Q117: 40 samples of size 2,500 were taken
Q118: When the purpose of sampling is to
Q119: The lower and upper control limits for
Q120: To ensure that a manufacturing process is
Q121: 50 samples of size 2,000 were taken
Q123: Sample proportions that are _ than the
Q124: We construct a p chart to track
Q125: In statistical process control,a Type I error
Q126: In order to test if a production
Q127: Diaper Delivery
Wrap-M-Up,a Ft.Lauderdale diaper Service,has 10
Unlock this Answer For Free Now!
View this answer and more for free by performing one of the following actions

Scan the QR code to install the App and get 2 free unlocks

Unlock quizzes for free by uploading documents