Student's Final Grade
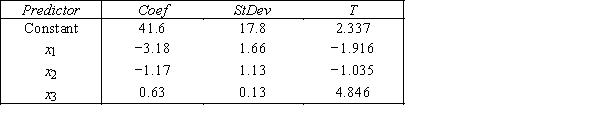
A statistics professor investigated some of the factors that affect an individual student's final grade in her course.She proposed the multiple regression model 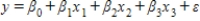 ,where y is the final grade (out of 100 points),x1 is the number of lectures skipped,x2 is the number of late assignments,and x3 is the midterm exam score (out of 100).The professor recorded the data for 50 randomly selected students.The computer output is shown below. THE REGRESSION EQUATION IS
 S = 13.74 R−Sq = 30.0% ANALYSIS OF VARIANCE
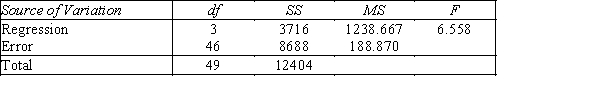
-{Student's Final Grade Narrative} Interpret the coefficient b1.
Correct Answer:
Verified
View Answer
Unlock this answer now
Get Access to more Verified Answers free of charge
Q83: Real Estate Builder
A real estate
Q84: Real Estate Builder
A real estate
Q85: Real Estate Builder
A real estate
Q86: Student's Final Grade
A statistics professor investigated
Q87: Real Estate Builder
A real estate
Q89: Student's Final Grade
A statistics professor investigated
Q90: Real Estate Builder
A real estate
Q91: Student's Final Grade
A statistics professor investigated
Q92: Real Estate Builder
A real estate
Q93: Real Estate Builder
A real estate
Unlock this Answer For Free Now!
View this answer and more for free by performing one of the following actions

Scan the QR code to install the App and get 2 free unlocks

Unlock quizzes for free by uploading documents