Which of the following statements describe(s) the line chart below? 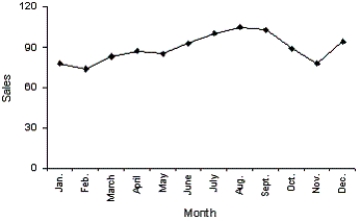
A) November experienced the lowest sales throughout the year.
B) August experienced the highest sales throughout the year.
C) Sales did not fluctuate more than 30 units on either side of 90.
D) All of these choices are true.
Correct Answer:
Verified
Q7: Time series data are often graphically depicted
Q55: A line chart is created by plotting
Q60: A line chart that is flat shows
Q70: Observations that are measured at successive points
Q76: Which of the following statements describes a
Q77: Time-series data are often graphically depicted how?
A)Bar
Q79: What kind(s)of data can be depicted by
Q91: A department store's monthly sales (in
Q93: The line chart below shows tomato prices
Q94: The line chart below shows potato prices
Unlock this Answer For Free Now!
View this answer and more for free by performing one of the following actions

Scan the QR code to install the App and get 2 free unlocks

Unlock quizzes for free by uploading documents