A professor examines the relationship between minutes studying and exam score (out of 200 points)for a random sample of his students.The scatter diagram is shown below.It appears that study time has somewhat of a positive linear relationship with exam score. 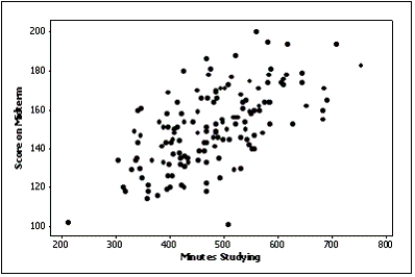
Correct Answer:
Verified
Q62: Briefly discuss the difference between cross-sectional data
Q66: A line chart is created by plotting
Q87: In order to draw a scatter diagram,we
Q88: The two most important characteristics revealed by
Q89: The graphical technique used to describe the
Q92: When two variables are linearly related,and tend
Q96: If we draw a straight line through
Q99: Which of the following statements is false?
A)You
Q105: Data for calories and salt content (milligrams
Q109: The first scatter diagram below shows a
Unlock this Answer For Free Now!
View this answer and more for free by performing one of the following actions

Scan the QR code to install the App and get 2 free unlocks

Unlock quizzes for free by uploading documents