 Admission to ER The following bar chart shows the type of aspirin (if any)given to 100 cardiac patients within 15 minutes of their admission to the emergency room.
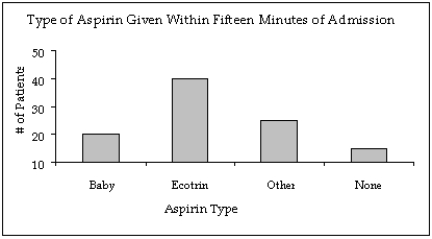
-{Admission to ER Narrative} In what way does the original bar chart distort the data as compared to a bar chart that starts at zero on the Y-axis (frequency axis)?
Correct Answer:
Verified
View Answer
Unlock this answer now
Get Access to more Verified Answers free of charge
Q146: Home Care Data are collected on
Q147: Briefly explain why the histogram below is
Q148: Credit Hours The College of Business at
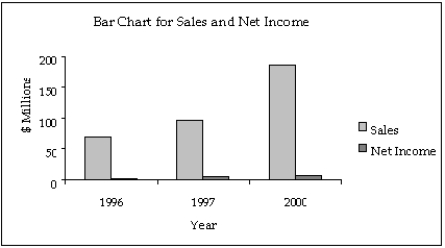
Q149: In its 2000 report,a company presented the
Q150: Home Care Data are collected on
Q152: Home Care Data are collected on
Q153: Samantha recorded her amount of exercise time
Q154: A graph showing trends over time is
Unlock this Answer For Free Now!
View this answer and more for free by performing one of the following actions

Scan the QR code to install the App and get 2 free unlocks

Unlock quizzes for free by uploading documents