Home Care Data are collected on the number of house calls (x)made in a given week by each of 60 nurses in a certain hospital.The same data set is displayed in each of the three histograms below. 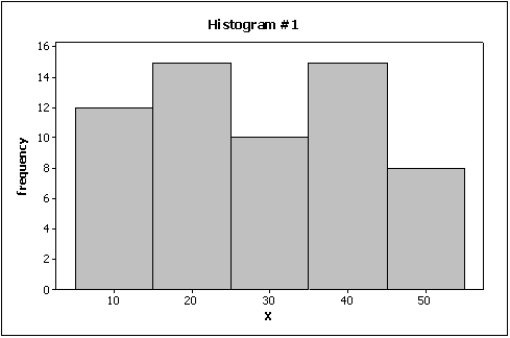
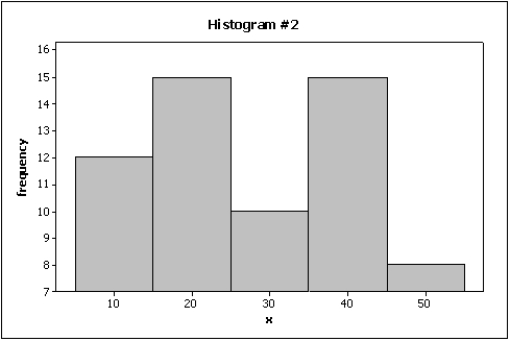
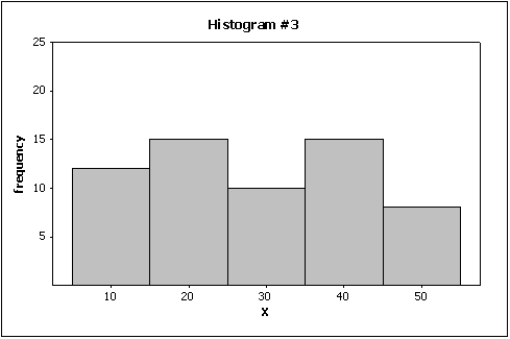
-{Home Care Narrative}Which graph do you think is the most appropriate display? Justify your answer.
Correct Answer:
Verified
View Answer
Unlock this answer now
Get Access to more Verified Answers free of charge
Q138: Differences in the frequencies of a histogram
Q139: The following graph shows pepper prices throughout
Q140: Possible methods of graphical deception include:
A)A graph
Q141: Slopes and trends in a line chart
Q142: Credit Hours The College of Business at
Q144: An online dating service has a quick
Q145: Below are two line charts where the
Q146: Home Care Data are collected on
Q147: Briefly explain why the histogram below is
Q148: Credit Hours The College of Business at
Unlock this Answer For Free Now!
View this answer and more for free by performing one of the following actions

Scan the QR code to install the App and get 2 free unlocks

Unlock quizzes for free by uploading documents