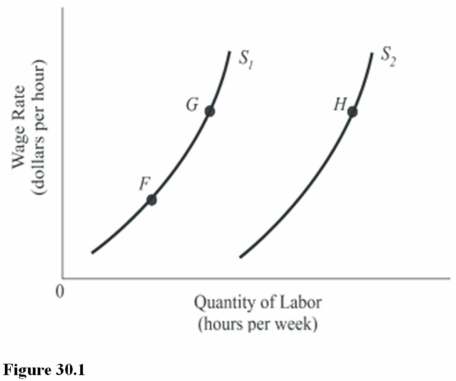
 In Figure 30.1, the shift in the labor supply curve from S1 to S2 means that
A) The marginal utility of labor has decreased.
B) Workers are being paid higher wage rates, given their taste for work.
C) The marginal utility of labor relative to leisure has increased.
D) The demand for labor has increased, and this encourages more labor force participation.
Correct Answer:
Verified
Q21: The market supply of labor is
A) The
Q22: If Sara's elasticity of labor supply is
Q25: An individual's labor supply curve
A)Slopes upward initially,and
Q28: The market supply curve for labor curve
Q29: If Reagan's substitution effects outweigh her income
Unlock this Answer For Free Now!
View this answer and more for free by performing one of the following actions

Scan the QR code to install the App and get 2 free unlocks

Unlock quizzes for free by uploading documents