Multiple Choice
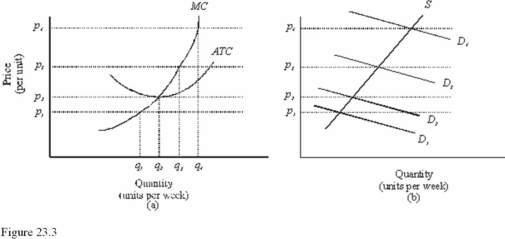 In Figure 23.3, diagram "a" presents the cost curves that are relevant to a firm's production decision, and diagram "b" shows the market demand and supply curves for the market. Use both diagrams to answer the following question: In Figure 23.3, if market demand is at D1, the firm should
A) Leave the market.
B) Produce q1.
C) Shut down.
D) Do any of the above depending on the position of the AVC and the length of the time period.
Correct Answer:
Verified
Related Questions
Q81: Marginal cost pricing in competitive markets results

