Which panel of Figure 3.3 represents the changes in the market for beef when the price of corn (cattle feed) rises and the people become more fearful of mad cow disease? 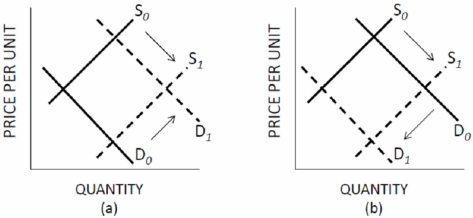
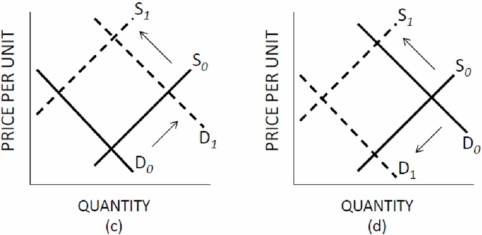 Figure 3.3 Shifts of Supply and Demand
A) A.
B) B.
C) C.
D) D.
Correct Answer:
Verified
Q102: If the price of "X" increases and
Q114: If corn products are found to cause
Q116: Complete Table 3.1. Then answer the indicated
Q116: If the price of "X" increases and
Q119: If the government required the actual market
Q122: A decrease in the price of bubble
Q125: The basic goals of total utility maximization,total
Q126: Unlike consumers and business firms,the public sector
Q127: An increase in the price of gasoline
Q134: If a price is above equilibrium,
A)A shortage
Unlock this Answer For Free Now!
View this answer and more for free by performing one of the following actions

Scan the QR code to install the App and get 2 free unlocks

Unlock quizzes for free by uploading documents