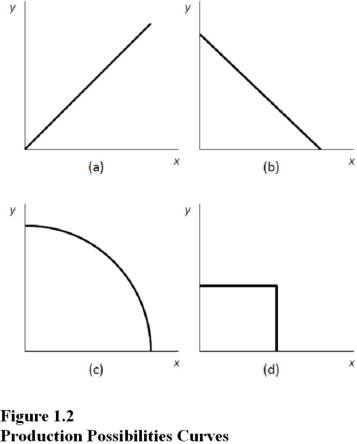
Choose the letter of the curve in Figure 1.2 that best represents a production possibilities curve for two goods for which there are constant opportunity costs:
A) A. B) B. C) C. D) D.
Correct Answer:
Verified
Unlock this answer now Get Access to more Verified Answers free of charge
 Choose the letter of the curve in Figure 1.2 that best represents a production possibilities curve for two goods for which there are constant opportunity costs:
