Use the figure below to answer the following question.
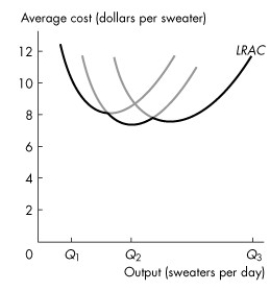 Figure 11.4.3
-Refer to Figure 11.4.3 which shows a firm's long-run average total cost curve.An increase in production from Q1 to Q2 sweaters per day produces
A) the minimum efficient scale.
B) economies of scale.
C) diseconomies of scale.
D) constant total costs.
E) constant returns to scale.
Correct Answer:
Verified
Q122: Use the table below to answer the
Q124: Use the figure below to answer the
Q125: Use the figure below to answer the
Q126: Use the figure below to answer the
Q128: The long-run average cost curve is the
Q131: Diminishing returns to capital _ occur as
Q138: A firm will want to increase its
Q141: The minimum efficient scale is the smallest
Q143: Economies of scale refer to the range
Q145: Diseconomies of scale refer to the range
Unlock this Answer For Free Now!
View this answer and more for free by performing one of the following actions

Scan the QR code to install the App and get 2 free unlocks

Unlock quizzes for free by uploading documents