Use the figure below to answer the following questions.
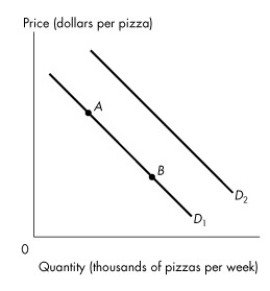 Figure 3.2.2
-Which one of the following would result in the demand curve shifting from D1 to D2 in Figure 3.2.2?
A) an increase in the supply of pizza
B) a rise in the price of hamburgers,a substitute for pizza
C) a rise in the price of pizza
D) a fall in the price of pizza
E) a rise in the price of Coke,a complement of pizza
Correct Answer:
Verified
Q5: Use the table below to answer the
Q6: Which market is an example of a
Q23: Use the figure below to answer the
Q27: A turnip is an inferior good if
A)an
Q27: If a turnip is an inferior good,then,ceteris
Q29: The price of good A rises,and the
Q31: Good A is a normal good if
A)a
Q34: Use the figure below to answer the
Q38: Use the figure below to answer the
Q39: A decrease in quantity demanded is represented
Unlock this Answer For Free Now!
View this answer and more for free by performing one of the following actions

Scan the QR code to install the App and get 2 free unlocks

Unlock quizzes for free by uploading documents