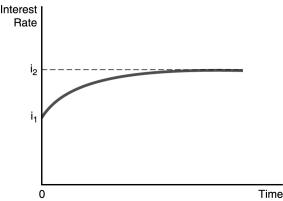
-The figure above illustrates the effect of an increased rate of money supply growth at time period 0. From the figure, one can conclude that the
A) Fisher effect is dominated by the liquidity effect and interest rates adjust slowly to changes in expected inflation.
B) liquidity effect is dominated by the Fisher effect and interest rates adjust slowly to changes in expected inflation.
C) liquidity effect is dominated by the Fisher effect and interest rates adjust quickly to changes in expected inflation.
D) Fisher effect is smaller than the expected inflation effect and interest rates adjust quickly to changes in expected inflation.
Correct Answer:
Verified
Q121: Milton Friedman called the response of lower
Q122: In the liquidity preference framework,a one-time increase
Q126: When the growth rate of the money
Q130: Q130: Use the following figure to answer the Q132: If the liquidity effect is smaller than Unlock this Answer For Free Now! View this answer and more for free by performing one of the following actions Scan the QR code to install the App and get 2 free unlocks Unlock quizzes for free by uploading documents![]()

