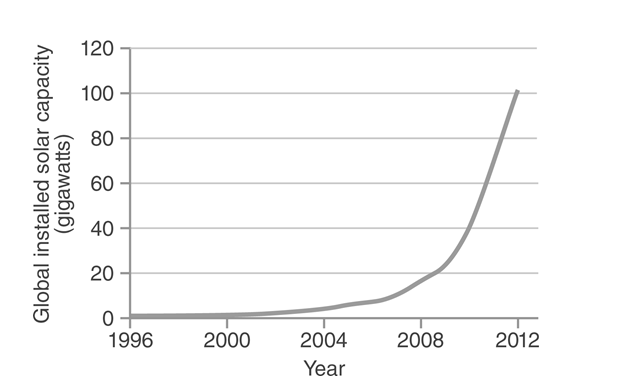
-According to the figure above,during which of the following periods did global installed solar capacity increase by the greatest percentage?
A) 2006 to 2010
B) 2008 to 2010
C) 2004 to 2006
D) 2010 to 2012
Correct Answer:
Verified
Q27: Passive solar is used in the design
Q28: Q29: The production of hydrogen used to power Q30: Current photovoltaic technology uses sunlight to generate Q31: Every winter morning when the sun is Q33: A home in Oklahoma is built into Q34: Coal would not be considered a renewable Q35: Compare and contrast solar water heaters and Q36: Although they have tremendous advantages,wind turbines_ . Q37: With today's technology,wind energy could only meet![]()
A)make
Unlock this Answer For Free Now!
View this answer and more for free by performing one of the following actions

Scan the QR code to install the App and get 2 free unlocks

Unlock quizzes for free by uploading documents