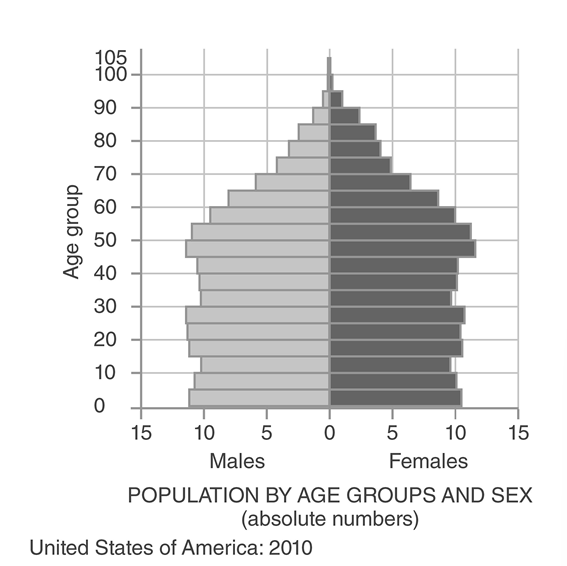
-Which one of the following statements about the figure above is true?
A) The size of each bar generally increases from the top down because of immigration.
B) The greater number of females 85 years or older reflects an unusually high percentage of females born between 1920 and 1925.
C) The declining size of bars from ages 40- 44 to ages 30- 34 most likely represents declining fertility rates.
D) The size of each bar generally increases from the top down because of increased fertility of later generations.
Correct Answer:
Verified
Q1: Q2: Assuming no immigration,at which point would this Q3: The United Nations' best estimate is that Q4: Q6: Q7: If the global population increases to 9 Q8: Which of the following continents is currently Unlock this Answer For Free Now! View this answer and more for free by performing one of the following actions Scan the QR code to install the App and get 2 free unlocks Unlock quizzes for free by uploading documents![]()
![]()
![]()

