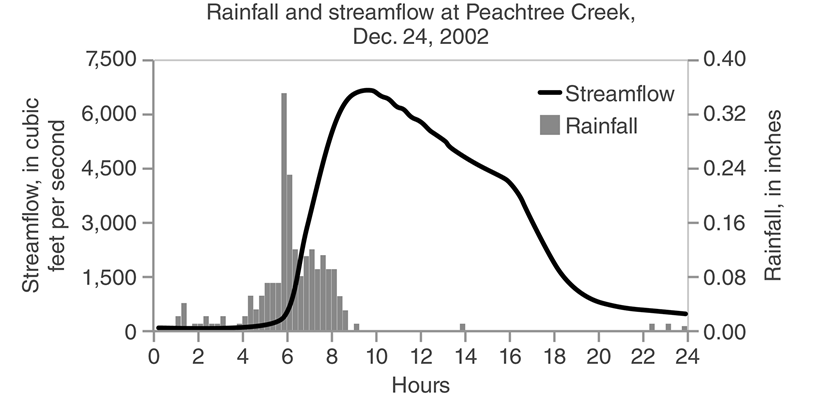
-The graph depicts rainfall and stream discharge during a flood event along Peachtree Creek on December 24,2002.Which of the following can be inferred from the graph?
A) Creek levels subsided as quickly as they rose.
B) Water levels in the creek returned to base levels by the end of the day.
C) Most of the rain fell during the time period from 8 A.M. to 5 P.M. 17:00) .
D) Creek water levels peaked 3 hours after the rain fell hardest.
Correct Answer:
Verified
Q1: The city of Orangeville,Iowa,gets all of its
Q3: Depletion of groundwater supplies can cause which
Q4: The city of Orangeville,Iowa,gets all of its
Q5: Artificial wetlands _.
A)can help purify water and
Q6: Which of the following foods requires the
Q7: All of the following are predicted to
Q8: Which of the following natural processes would
Q9: Most of the water on Earth is
Q10: Where will you find a riparian zone?
A)In
Q11: Which of the following is an example
Unlock this Answer For Free Now!
View this answer and more for free by performing one of the following actions

Scan the QR code to install the App and get 2 free unlocks

Unlock quizzes for free by uploading documents