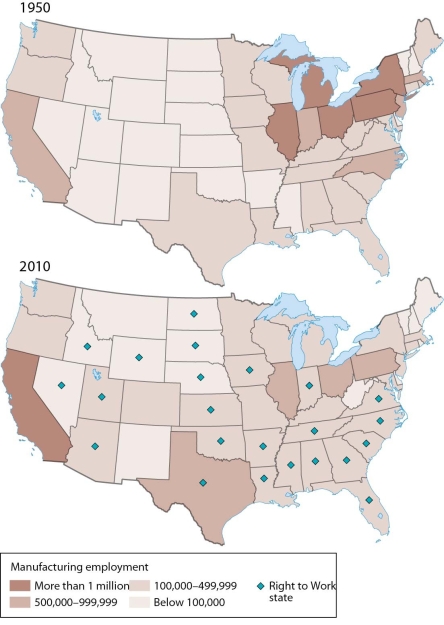
-An analysis of these maps showing changes in U.S. manufacturing from 1950 to 2010 indicates that
A) the percentage of manufacturing jobs remained largely unchanged.
B) the number of manufacturing jobs increased in nearly all "right-to-work" states.
C) the number of manufacturing jobs in Indiana increased when it became a "right-to-work" state.
D) the number of manufacturing jobs increased in most "right-to-work" states and decreased in most other states.
E) the number of manufacturing jobs increased in California and Colorado, which are not "right-to-work" states.
Correct Answer:
Verified
Q70: Mexico's maquiladora plants
A) must operate far from
Q71: About three-fourths of world industrial production is
Q72: Q73: What two location factors influence more industries Q74: In contrast to Fordist production, Post-Fordist production Q76: Maintaining control over all phases of a Q77: Prior to the Industrial Revolution, cottage industries Q78: The dominant industrial power in the nineteenth Q79: The new international division of labor reflects Q80: ![]()
![]()
Unlock this Answer For Free Now!
View this answer and more for free by performing one of the following actions

Scan the QR code to install the App and get 2 free unlocks

Unlock quizzes for free by uploading documents