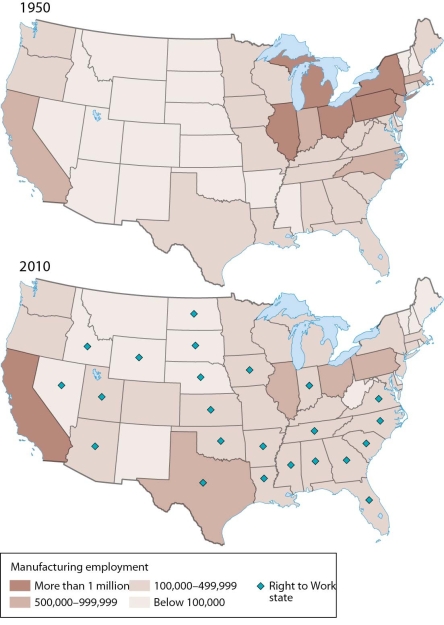
-An analysis of these maps showing changes in U.S. manufacturing from 1950 to 2010 indicates that
A) the percentage of manufacturing jobs increased in California.
B) the percentage of manufacturing jobs decreased only in the Midwest and Northeast.
C) the number of manufacturing jobs increased only in "right-to-work" states.
D) the number of manufacturing jobs increased markedly in Ohio, Michigan, New York, and Pennsylvania.
E) the number of manufacturing jobs decreased markedly in Ohio, Michigan, New York, and Pennsylvania.
Correct Answer:
Verified
Q60: Q61: Wood became the main energy source during Q62: Industry is uniformly distributed across Earth. Q63: Mexico's maquiladora plants Q64: The invention of the steam engine in Q66: Twenty-three U.S. states have so-called "right-to-work" laws Q67: The Rhine-Ruhr River valley in Europe is Unlock this Answer For Free Now! View this answer and more for free by performing one of the following actions Scan the QR code to install the App and get 2 free unlocks Unlock quizzes for free by uploading documents![]()
A) are distributed evenly across

