Multiple Choice
The accompanying diagram shows the effect of levying an income tax on the consumer.The pre-tax optimum is at point A,and the post-tax optimum is at point B. 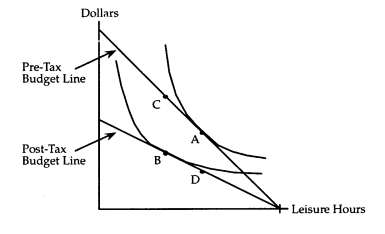 To measure the amount of tax money collected by the government,one uses the vertical distance between points
A) A and B.
B) A and D.
C) B and C.
D) B and D.
Correct Answer:
Verified
Related Questions
Q59: Goods X and Y
For the following questions,
Q60: Suppose a price index is formed to
Q61: Consider an income tax and a head
Q62: If the price of good X goes
Q63: Last year,the price of heating oil was
Unlock this Answer For Free Now!
View this answer and more for free by performing one of the following actions

Scan the QR code to install the App and get 2 free unlocks

Unlock quizzes for free by uploading documents